


- The first-party pixel tags an AI session at the source, so it captures more of your true AI traffic.
- Google Analytics (GA4) only credits AI sessions that arrive with an intact referrer — 35–70% arrive without one and get filed under “Direct.”
Screen Reference
AI Traffic and Revenue: Full-Funnel Store Analytics
Explore how AI shopping assistants find, navigate, and convert on your store — with full funnel metrics, source breakdowns, and honest attribution.
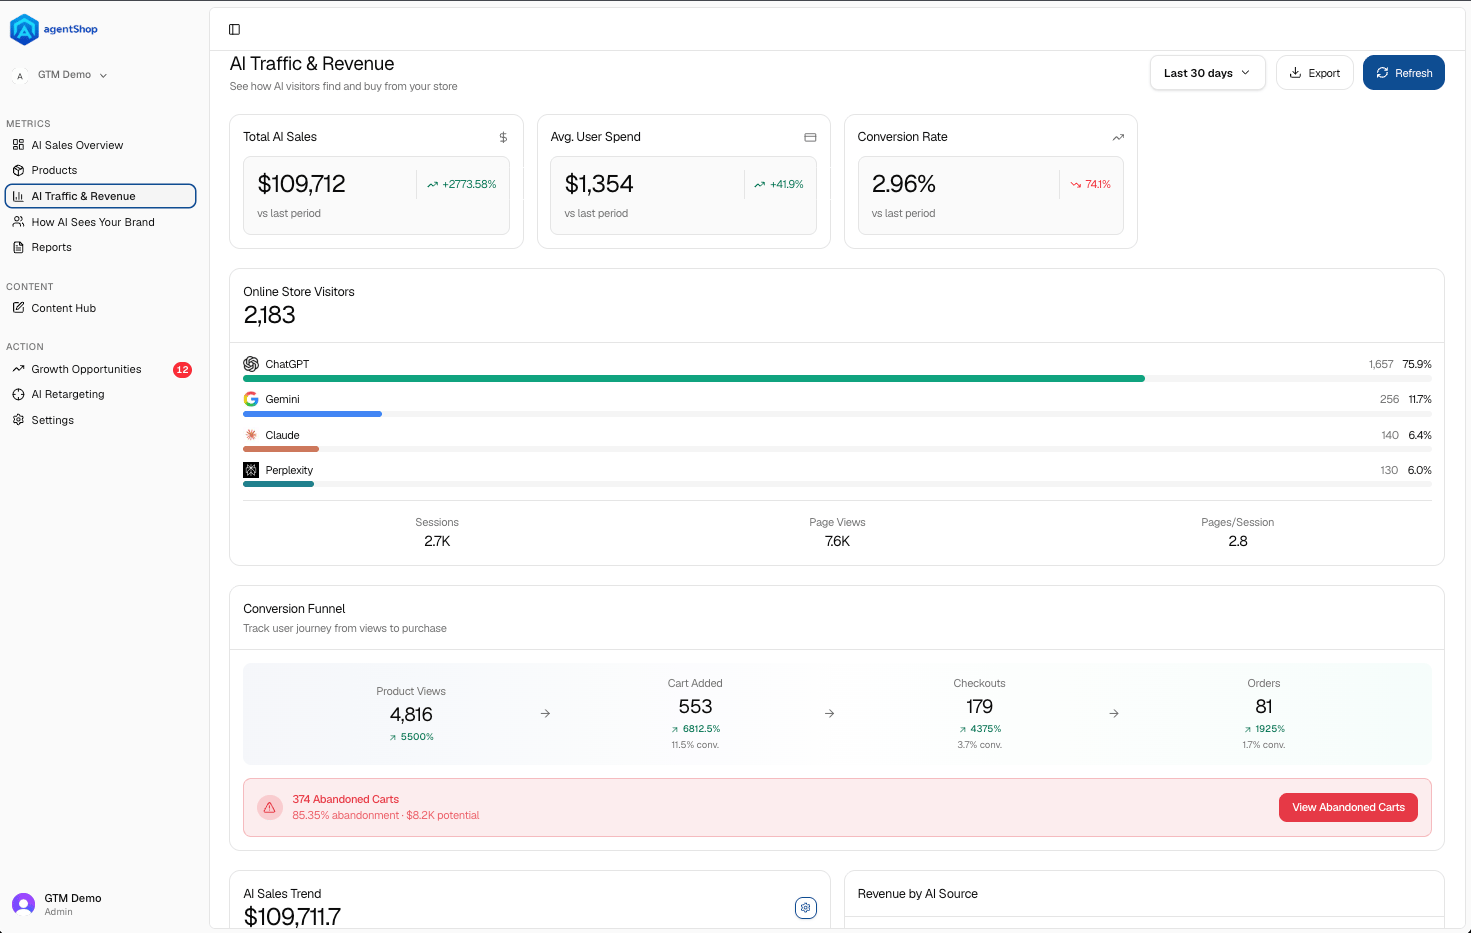
AI Traffic & Revenue is the deep dive behind the Sales Overview — the full story of how AI visitors find your store, move through it, and buy. Where the Overview gives you the headline, this page shows the mechanics: which assistant sends traffic, where shoppers drop off, what they buy, and how confident you can be in the numbers. Use the controls up top to set the date range (as with the Overview, go as long as your data allows), Export the view, or Refresh it.
The three cards are the summary line: Total AI Sales, Avg. User Spend, and Conversion Rate, each against the previous period. Read the direction, not just the value — a short window on low-volume AI sales moves sharply.
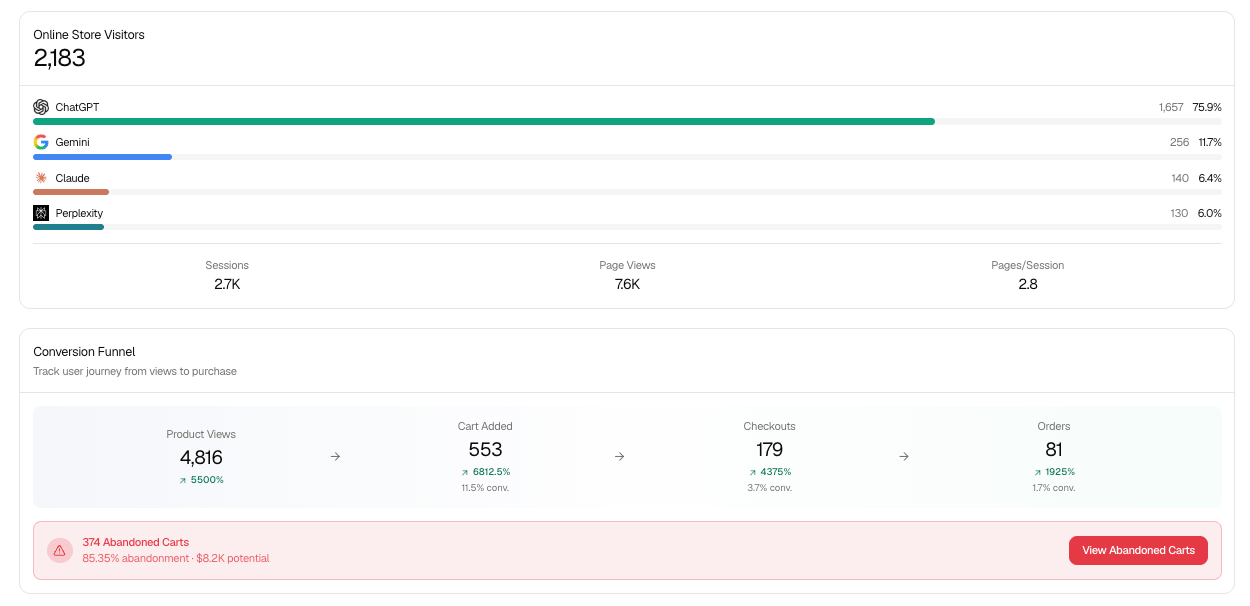
Online Store Visitors breaks your AI traffic down by source — ChatGPT, Gemini, Perplexity, Claude — with each one’s share. Early on, one assistant usually dominates; this is where you see which. Below it, Sessions, Page Views, and Pages/Session give you the shape of engagement.
The Conversion Funnel tracks the journey from Product Views → Cart Added → Checkouts → Orders, with the conversion rate at each step so you can see where the biggest drop happens. The red Abandoned Carts banner quantifies what’s slipping away — the number of abandoned carts, the abandonment rate, and the revenue potential — and View Abandoned Carts takes you to the recovery detail.
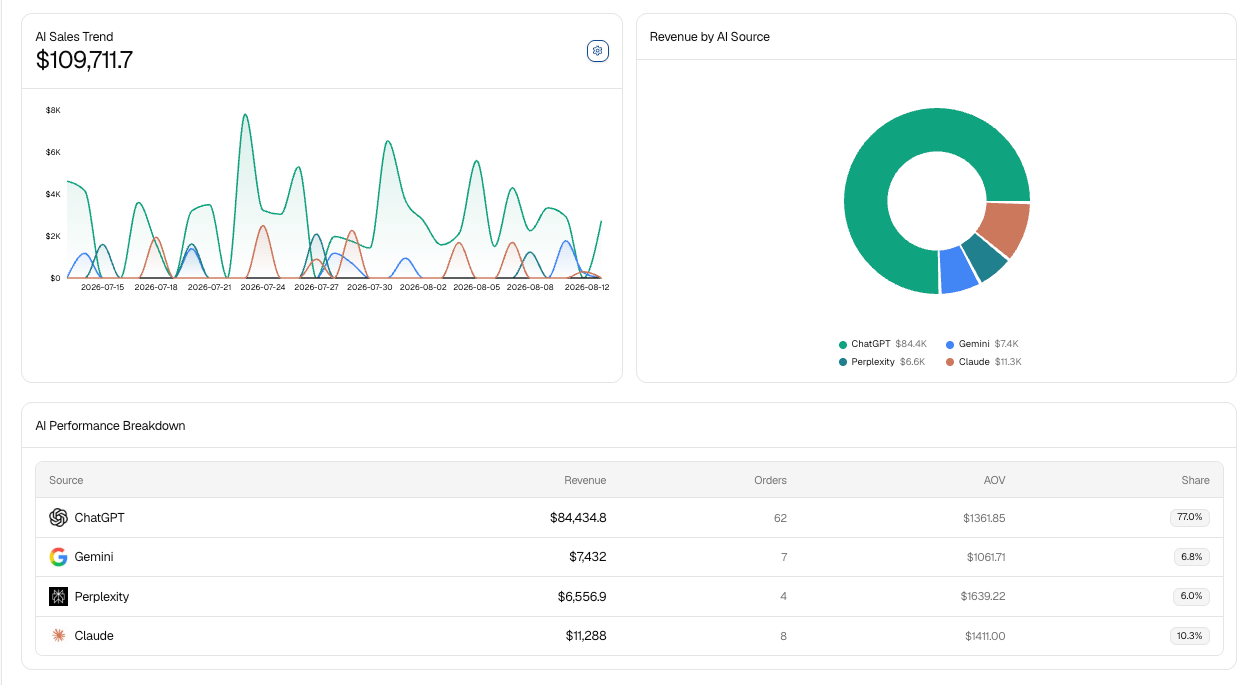
AI Sales Trend and Revenue by AI Source visualize the same revenue two ways: over time (momentum) and by platform (who’s driving it). The AI Performance Breakdown table puts hard numbers to it — revenue, orders, AOV, and share per source.
User Behavior and Session Time Distribution cover engagement quality: total active users, average session length and pages, bounce rate, and a health read, plus how sessions split across time buckets (from under a minute to 10+ minutes) graded low, average, and high engagement. This tells you whether AI visitors are actually engaging or bouncing.
Top Products by Views ranks products on how they move through view → cart → purchase, with the conversion rates between each step — useful for spotting a product that gets looked at but never bought. Daily Activity charts views, cart adds, and purchases day by day so you can tie spikes back to what you shipped or published.
Advanced Analytics is the honesty centerpiece — spend a moment here. This section reconciles two ways of measuring AI traffic:
Related topics
Screen Reference: Every agentShop Screen at a GlanceReports: Pre-Built Analytics for AI Commerce PerformanceAI Attribution: Why Your Revenue Numbers Are IncompleteagentShop Settings: Store, Integrations, and BillingQuick Start: Connect Shopify and Run Your First Brand Audit
