
AI Revenue Pulse
Your weekly pulse-check. AI-driven revenue at a glance — AI Revenue, AI Orders, AOV, and AI Conversion Rate, plus sessions and engagement, each against the previous period. Top platforms by revenue ranks the assistants producing sales, and Weekly AI revenue trends the last 10 weeks. Open it to answer: is AI revenue growing, and which assistant is carrying it?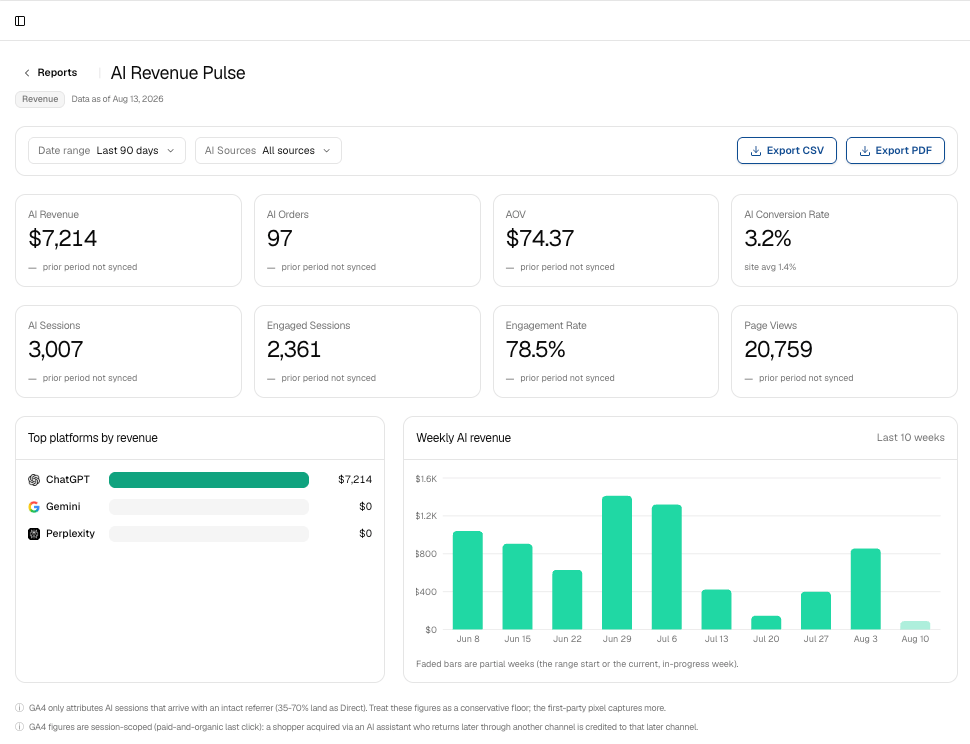
AI Conversion Funnel
Find where you’re losing orders. Tracks Product Views → Cart Added → Checkouts → Orders, with the continue rate at each step and the biggest leak flagged. Toggle AI sessions vs. all sessions to compare AI shoppers against your whole store. Steps are event counts, not unique users, so read the rates as an approximate funnel.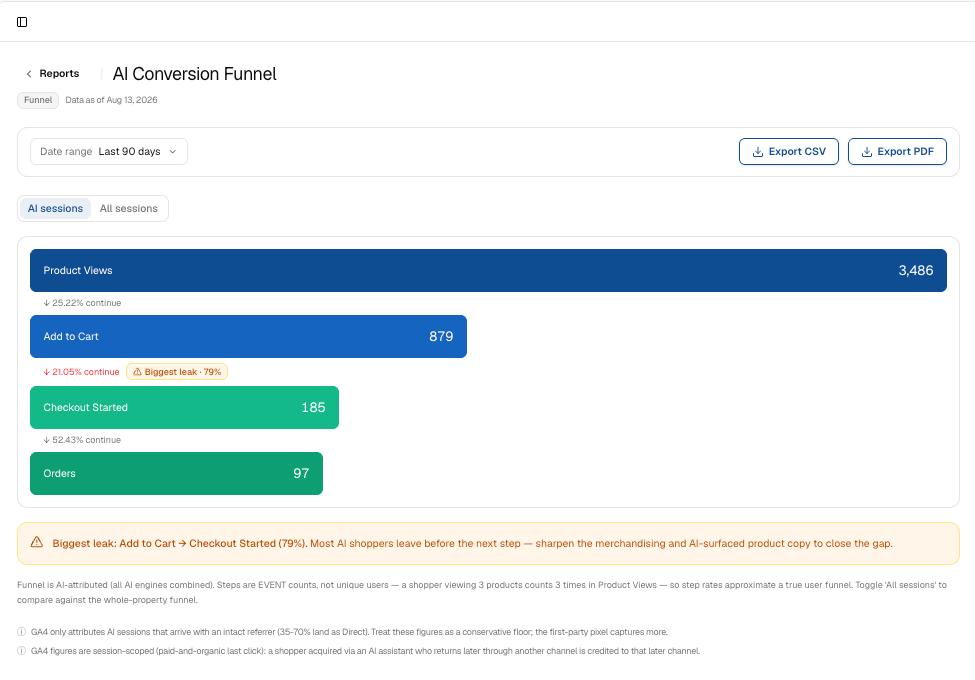
AI Search Report Card
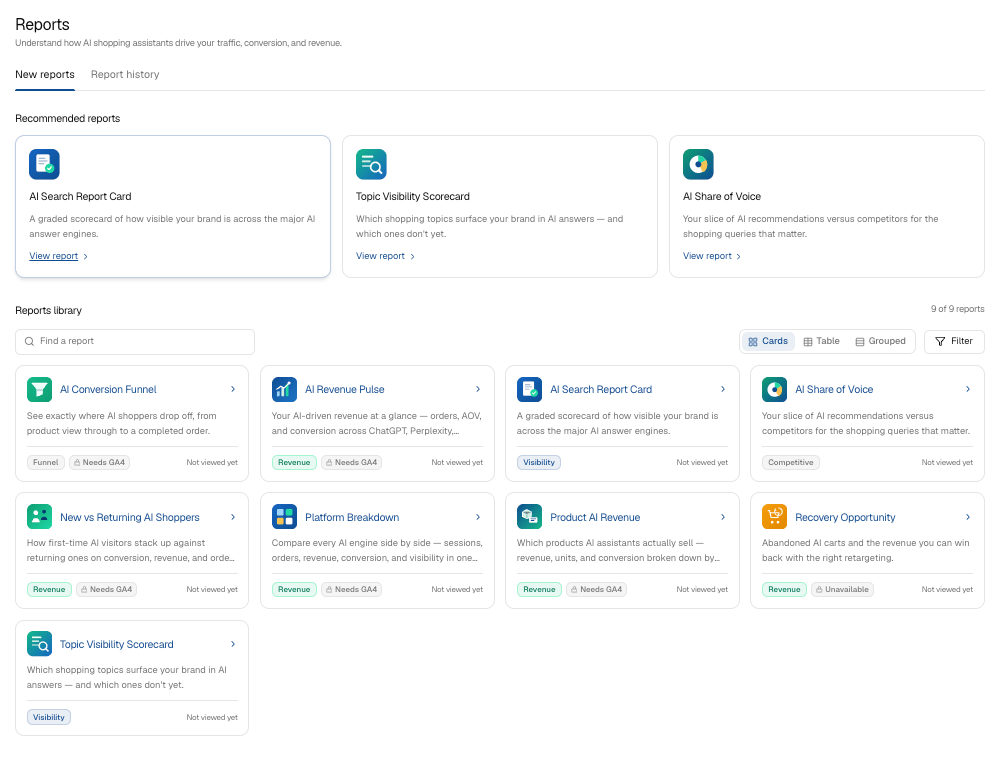
Are we getting chosen? A graded scorecard of your visibility across the major AI answer engines — an overall grade, a grade per platform (ChatGPT, Gemini, Perplexity), and a visibility score per shopping topic. Hit Refresh to re-sample. (Sampled from ChatGPT, Gemini, Perplexity, and Grok; Claude isn’t covered yet.)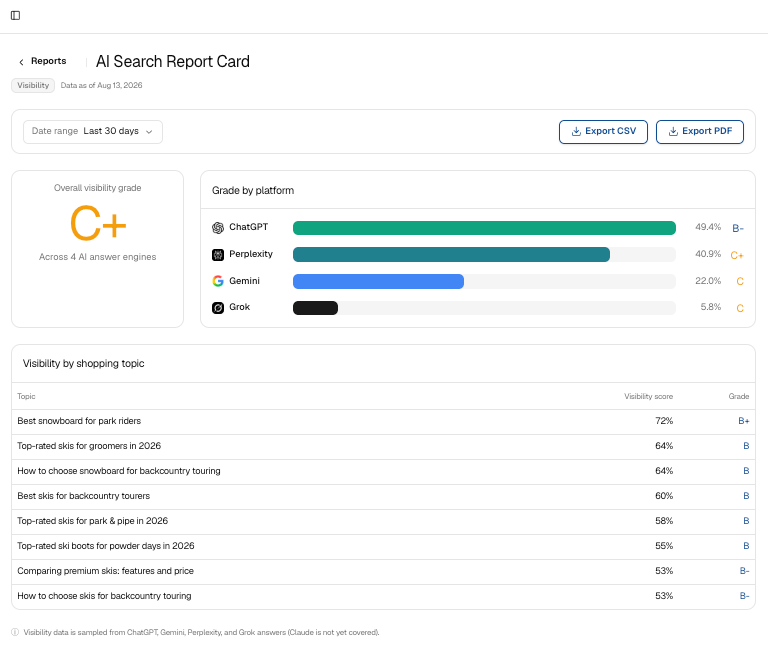
AI Share of Voice
You vs. the competition. Your slice of AI recommendations versus competitors for the queries that matter — your overall share of brand mentions, a chart of you vs. competitors, and a by-engine table showing where a rival is beating you. Use Manage competitors to set the comparison set.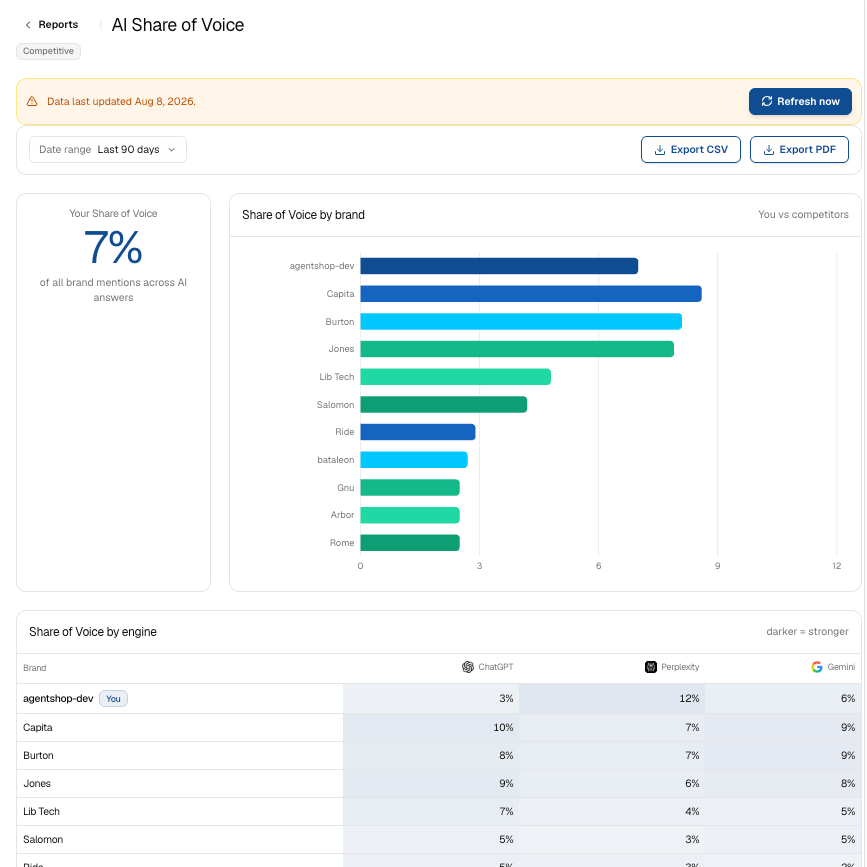
New vs. Returning AI Shoppers
Where retargeting pays off. Compares first-time AI visitors to returning ones on conversion, orders, AOV, and revenue. Returning shoppers usually convert far better — which tells you retargeting that segment is a high-yield lever.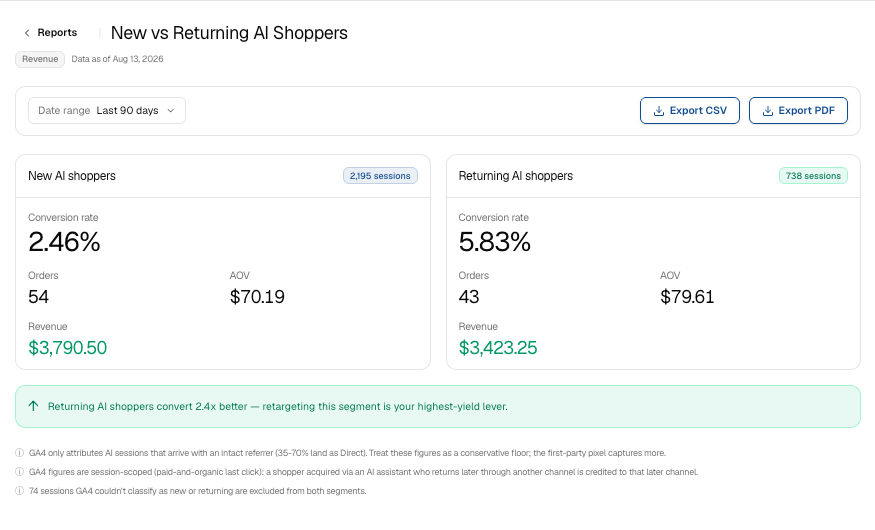
Platform Breakdown
Every engine in one table. All AI engines side by side — Sessions, Engaged, Engagement %, Page Views, Orders, Revenue, AOV, CVR, Visibility %, and SOV %. Visibility and SOV come from agentShop’s answer scraping; the commerce columns come from GA4.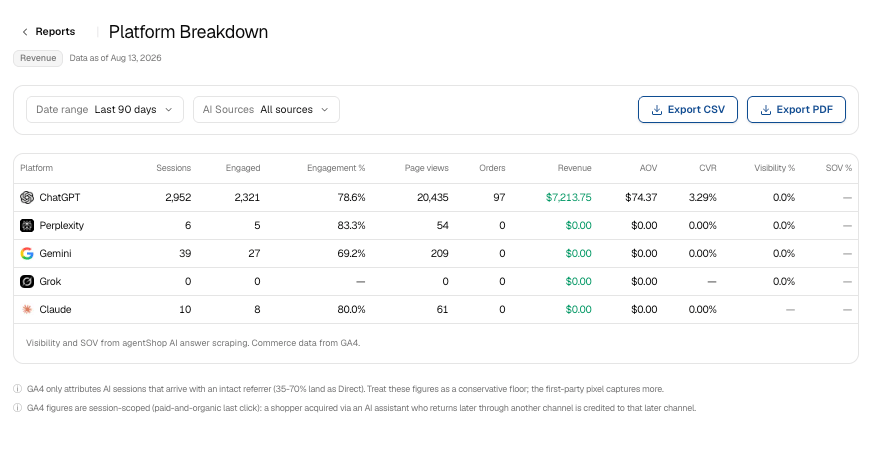
Product AI Revenue
What AI is already selling for you. Which products AI assistants actually sell, by revenue, units, and AI CVR (a view-to-purchase rate). A chart ranks products by AI revenue and the table flags your top-revenue SKUs — use it to pick which winners deserve deeper product-page optimization.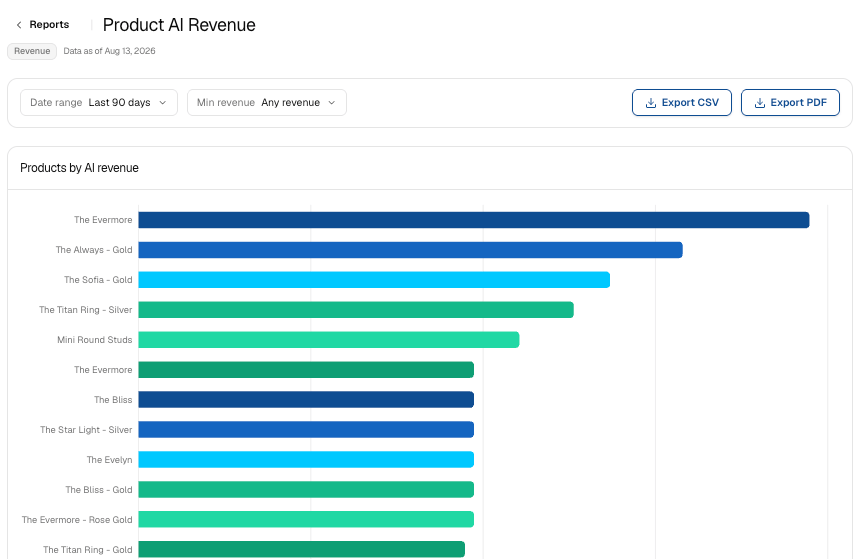
Recovery Opportunity
Revenue you can win back. Abandoned AI carts and the revenue you could recover — abandoned sessions, recoverable revenue, and average cart value up top, then carts sorted by value plus an “appears in 2+ abandoned carts” list of repeat offenders. (May show as Unavailable until its data source is connected.)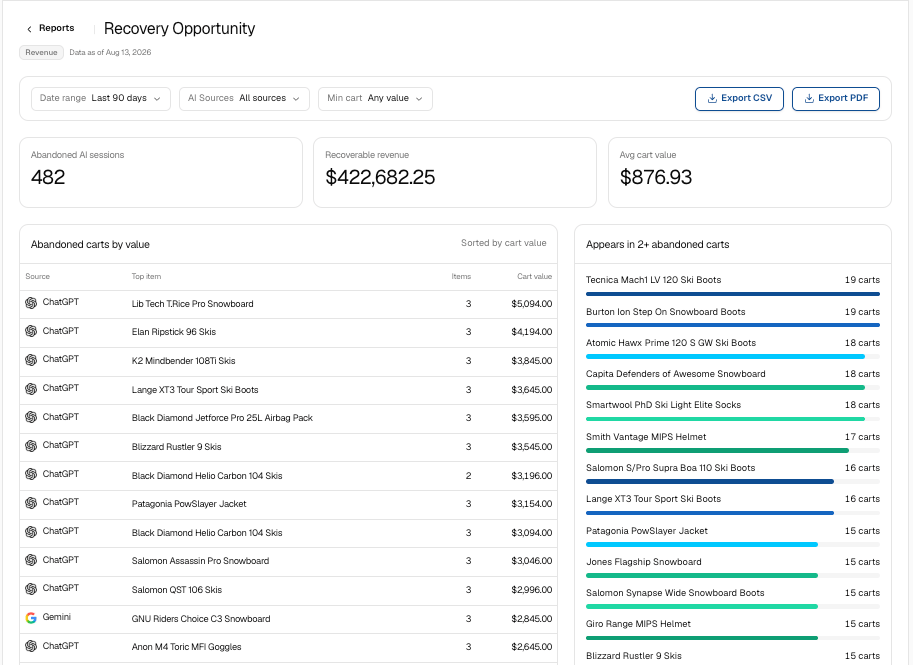
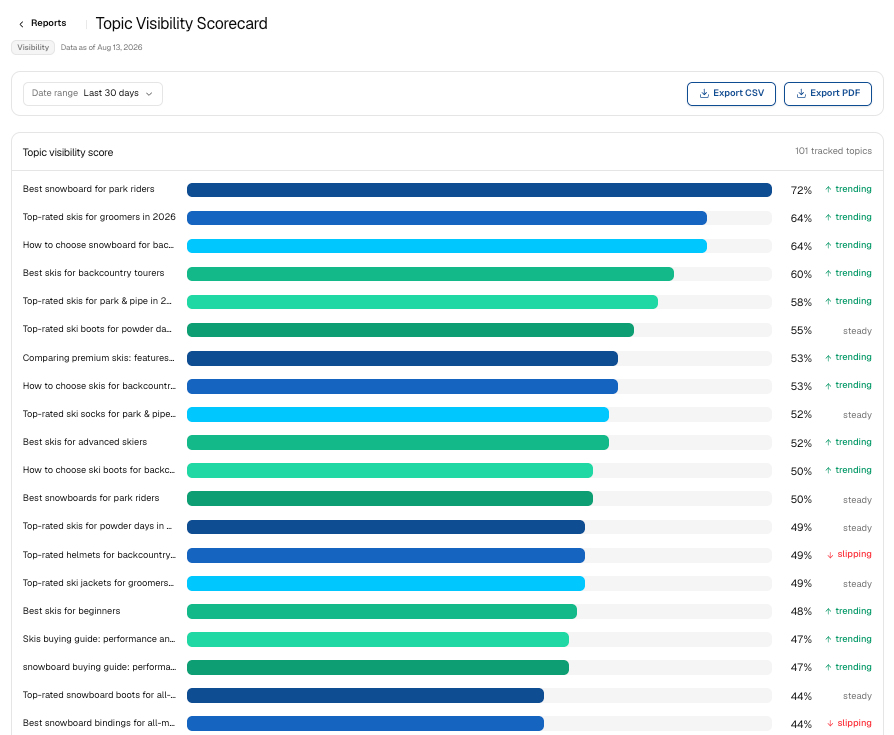
Topic Visibility Scorecard
The topics you’re missing. A ranked list of your tracked topics, each with a visibility-score bar, a percentage, and a trend indicator (steady / up / down). Shows when the data was last updated (with Refresh) and exports to CSV or PDF. Use it to find high-intent topics where you’re absent or slipping, then aim your content and product-page work at those gaps.