
The AI Sales Overview is your home base — the one screen that answers “is AI shopping actually selling for me?” Buyers are discovering and buying your products inside AI shopping experiences, and this page pulls the whole picture into one view: revenue, how many products are live, how well they convert, and where the sales are coming from.
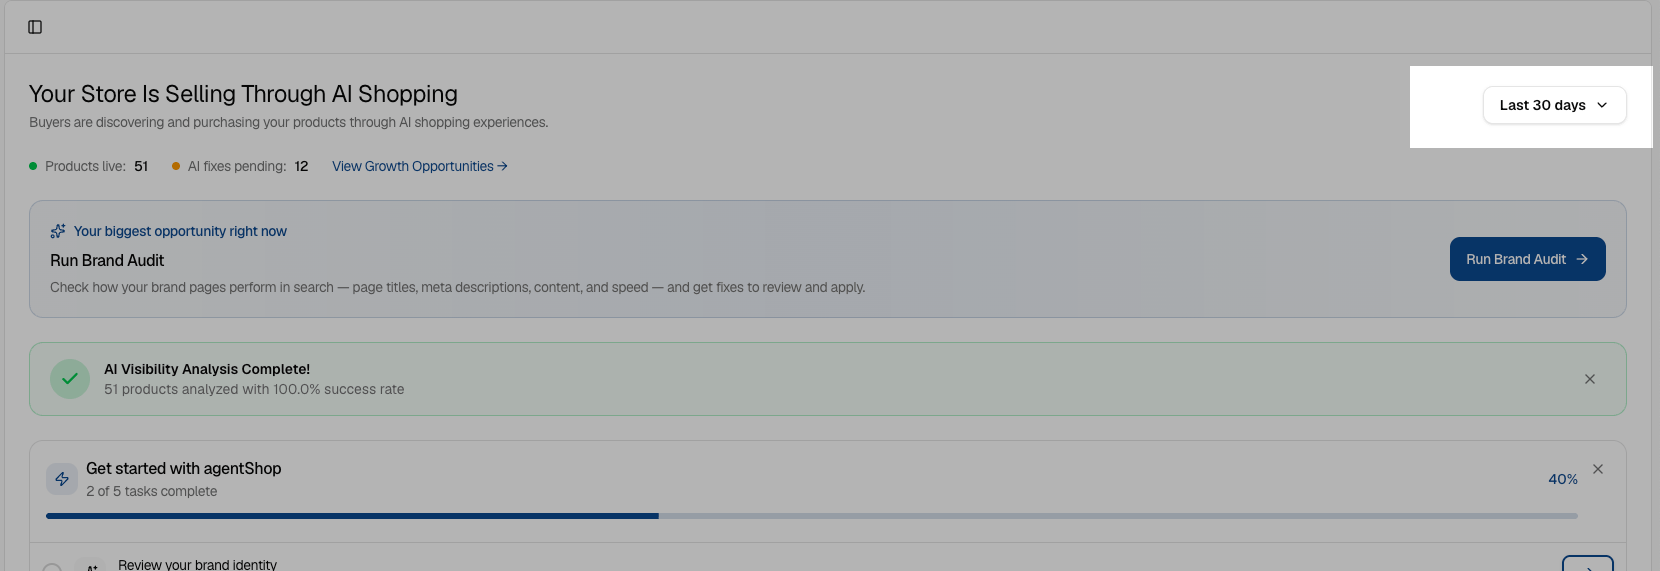
Set your date range first. The window in the top right drives every number on the page. As a rule, go as long as the data allows — Last 90 days is the best default, because AI-driven sales are still low-volume for most stores and a short window swings wildly on a handful of orders. A longer window smooths that out and shows the real trend. The exception is a new store: if you haven’t been live for 90 days, pick the longest range you do have (since launch) so you’re not looking at half-empty charts. Longer is better, wherever it applies.
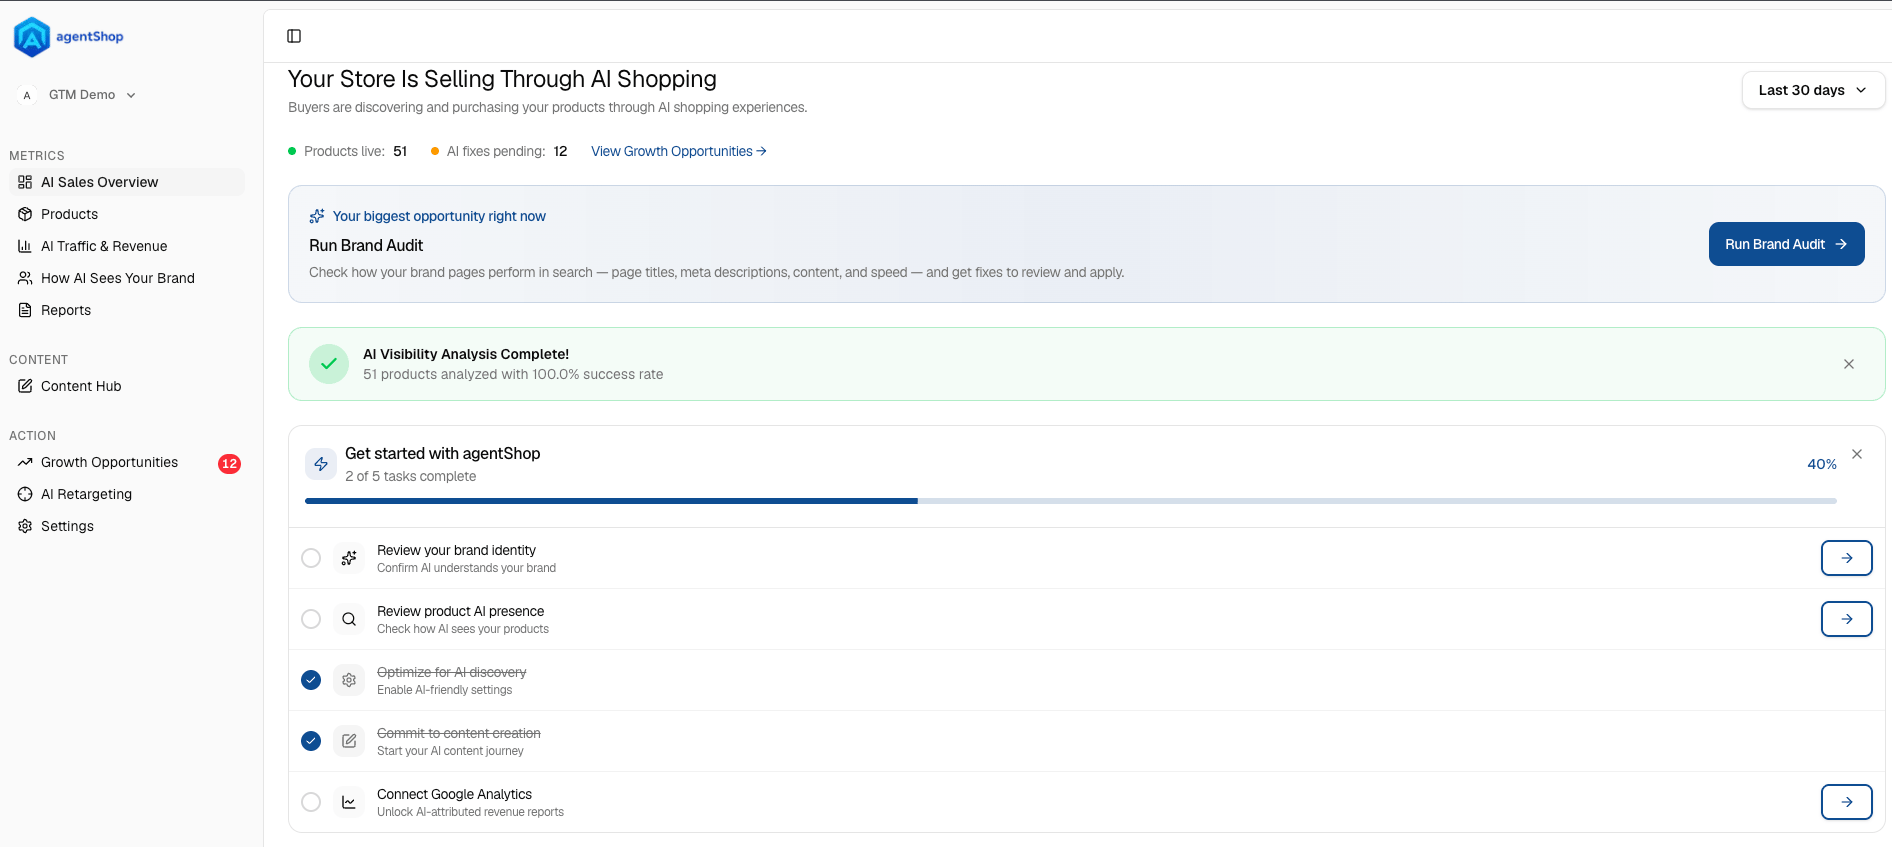
The status strip up top gives you the quick pulse: how many products are live in AI, how many AI fixes are pending, and a shortcut to View Growth Opportunities — the queue where those fixes and other agent-drafted work wait for your approval. The “biggest opportunity right now” banner is a nudge toward the single highest-value action available — often Run Brand Audit, which checks how your pages perform and hands back fixes to review. Think of it as the app pointing at what to do next. On a newer store, you’ll also see a “Get started with agentShop” checklist with steps like review your brand identity, review product AI presence, optimize for AI discovery, commit to content creation, and connect Google Analytics. It’s a guided setup path; it’s dismissible and disappears once you’re set up, so don’t worry if you don’t see it on an established store. The three cards are your headline metrics:
  • AI Revenue — sales attributed to AI shopping in the window, with the change versus the previous period.
  • Products Live in AI — how many products have complete AI visibility data (i.e., are fully in the game).
  • Conversion Rate — how often AI-driven visits turn into orders, again versus last period.
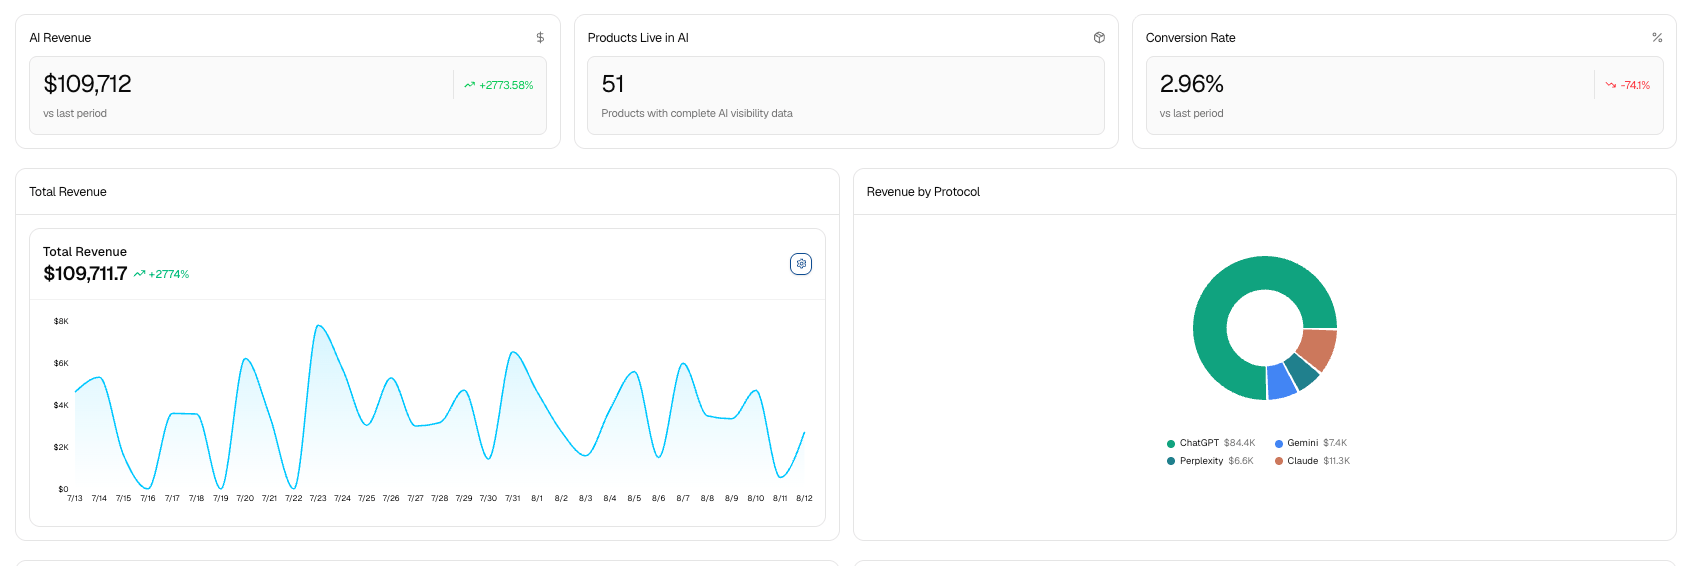
One caveat worth stating whenever you read these: AI attribution is conservative by nature — a large share of AI-referred visits land in analytics as “Direct.” So treat the revenue and conversion figures as a floor, not the full story. The trend direction matters more than any single number. The two charts below show the shape of it. Total Revenue plots AI-driven revenue over time so you can see momentum and spot the spikes. Revenue by Protocol breaks the same revenue down by AI platform (ChatGPT, Gemini, Perplexity), so you can see which assistant is actually driving sales — usually one dominates early, and this tells you which.
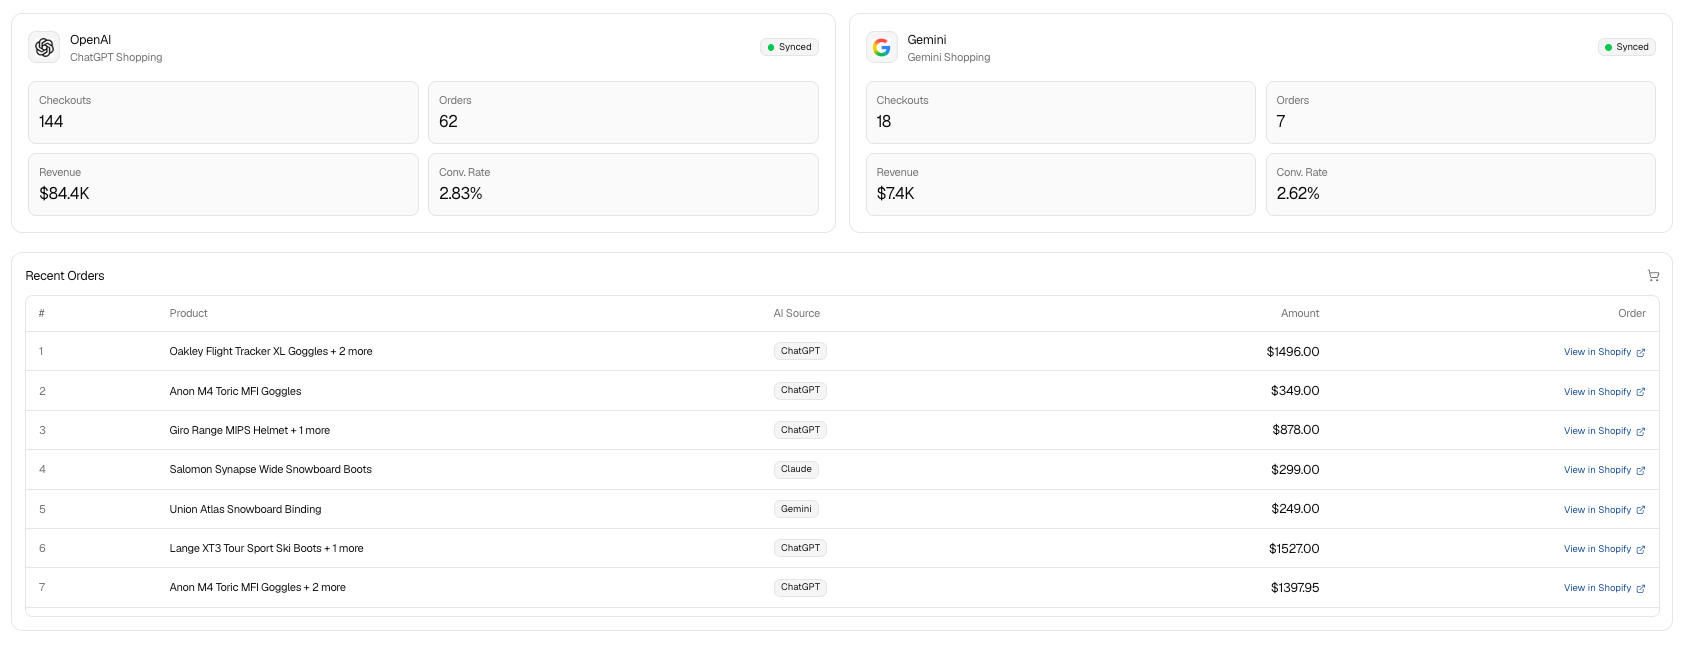
The channel panels (e.g. OpenAI / ChatGPT Shopping and Gemini / Gemini Shopping) go a level deeper per platform: whether the channel is synced, plus its checkouts, orders, revenue, and conversion rate. This is where you confirm each integration is connected and pulling its weight. Recent Orders at the bottom is the proof — actual orders that came through AI, with the product, the AI source that drove it, the amount, and a link to view the order in Shopify. When someone asks “does this really work,” this is the table to point at.
Put together: set the widest sensible date range, read the three cards for the headline, use the charts to see the trend and which platform is winning, check the channel panels to confirm everything’s synced, and scan Recent Orders for the receipts.