> ## Documentation Index
> Fetch the complete documentation index at: https://docs.useagentshop.com/llms.txt
> Use this file to discover all available pages before exploring further.
# AI Traffic and Revenue: Full-Funnel Store Analytics
> Explore how AI shopping assistants find, navigate, and convert on your store — with full funnel metrics, source breakdowns, and honest attribution.
**AI Traffic & Revenue** is the deep dive behind the Sales Overview — the full story of how AI visitors find your store, move through it, and buy. Where the Overview gives you the headline, this page shows the mechanics: which assistant sends traffic, where shoppers drop off, what they buy, and how confident you can be in the numbers. Use the controls up top to set the **date range** (as with the Overview, go as long as your data allows), **Export** the view, or **Refresh** it.
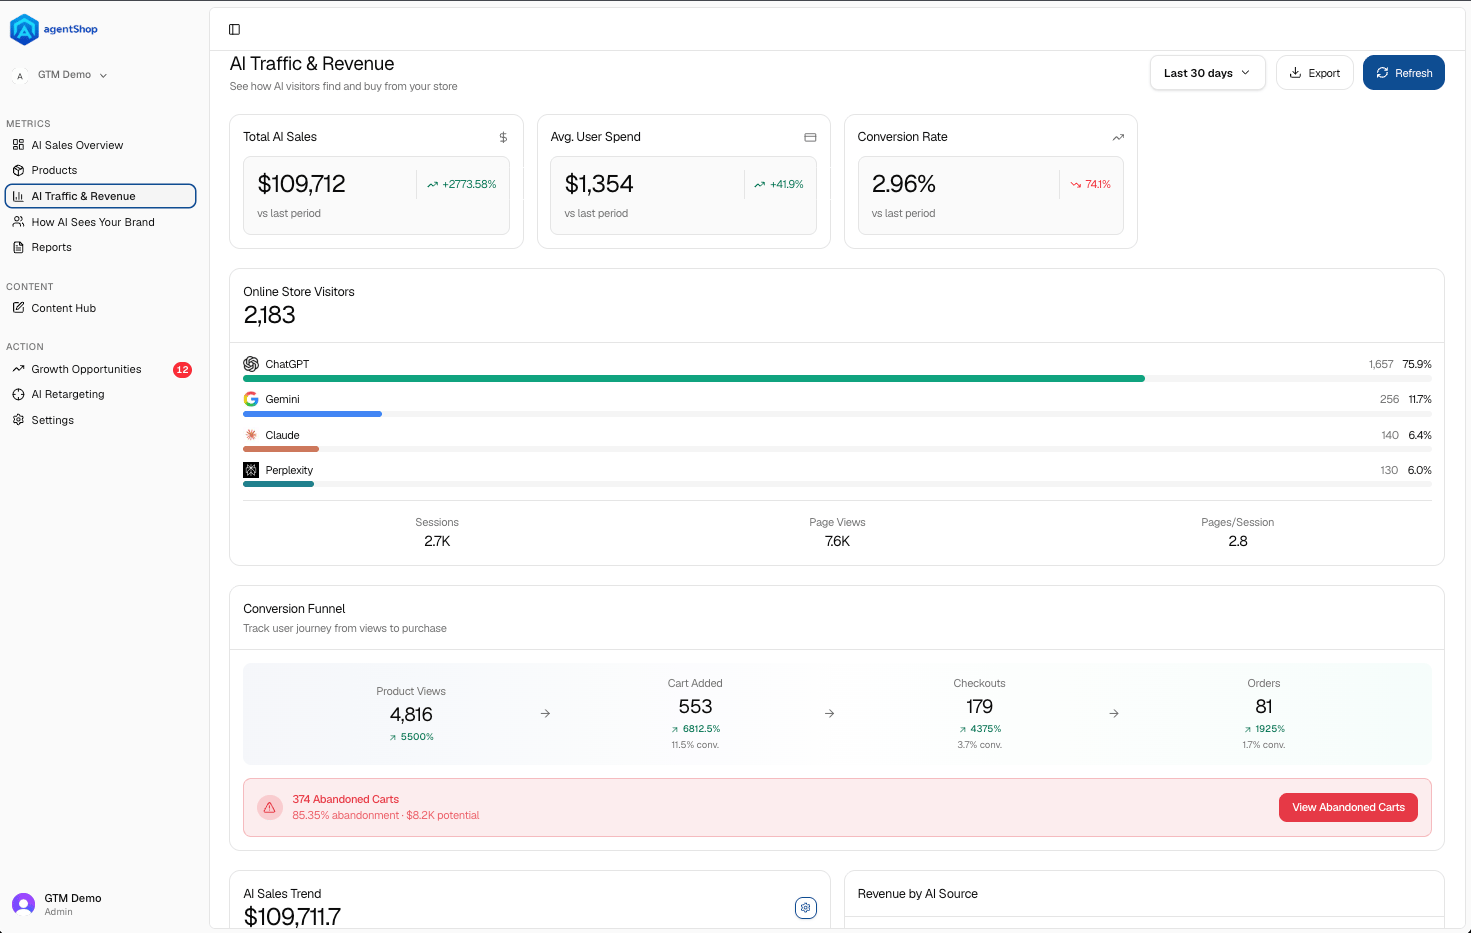 **The three cards** are the summary line: **Total AI Sales**, **Avg. User Spend**, and **Conversion Rate**, each against the previous period. Read the direction, not just the value — a short window on low-volume AI sales moves sharply.
 **Online Store Visitors** breaks your AI traffic down by source — ChatGPT, Gemini, Perplexity, Claude — with each one's share. Early on, one assistant usually dominates; this is where you see which. Below it, **Sessions, Page Views, and Pages/Session** give you the shape of engagement.
**The Conversion Funnel** tracks the journey from Product Views → Cart Added → Checkouts → Orders, with the conversion rate at each step so you can see where the biggest drop happens. The red **Abandoned Carts** banner quantifies what's slipping away — the number of abandoned carts, the abandonment rate, and the revenue potential — and **View Abandoned Carts** takes you to the recovery detail.
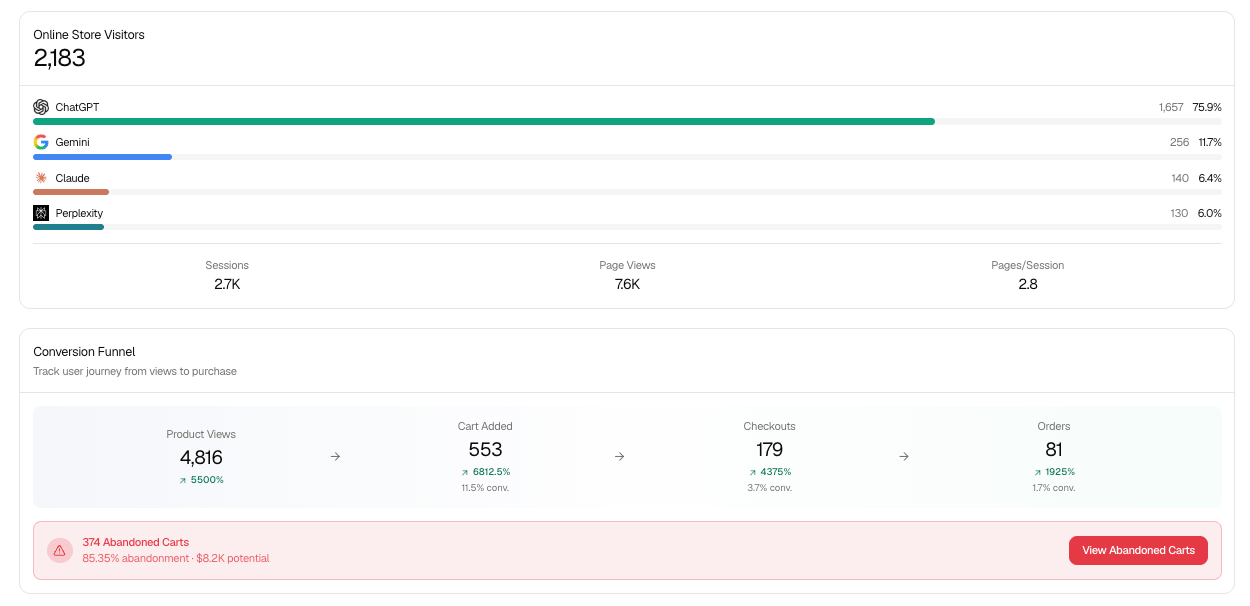
**Online Store Visitors** breaks your AI traffic down by source — ChatGPT, Gemini, Perplexity, Claude — with each one's share. Early on, one assistant usually dominates; this is where you see which. Below it, **Sessions, Page Views, and Pages/Session** give you the shape of engagement.
**The Conversion Funnel** tracks the journey from Product Views → Cart Added → Checkouts → Orders, with the conversion rate at each step so you can see where the biggest drop happens. The red **Abandoned Carts** banner quantifies what's slipping away — the number of abandoned carts, the abandonment rate, and the revenue potential — and **View Abandoned Carts** takes you to the recovery detail.
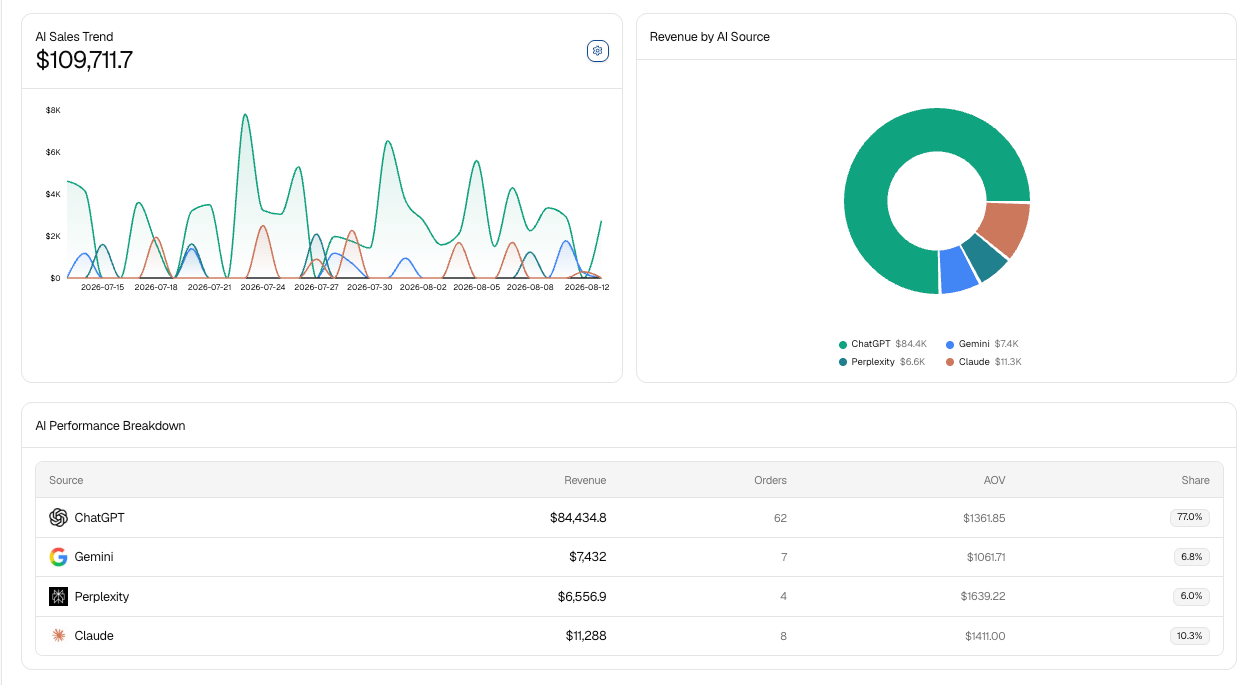
 **AI Sales Trend and Revenue by AI Source** visualize the same revenue two ways: over time (momentum) and by platform (who's driving it). The **AI Performance Breakdown** table puts hard numbers to it — revenue, orders, AOV, and share per source.
**User Behavior and Session Time Distribution** cover engagement quality: total active users, average session length and pages, **bounce rate**, and a health read, plus how sessions split across time buckets (from under a minute to 10+ minutes) graded low, average, and high engagement. This tells you whether AI visitors are actually engaging or bouncing.
**Top Products by Views** ranks products on how they move through view → cart → purchase, with the conversion rates between each step — useful for spotting a product that gets looked at but never bought. **Daily Activity** charts views, cart adds, and purchases day by day so you can tie spikes back to what you shipped or published.
**AI Sales Trend and Revenue by AI Source** visualize the same revenue two ways: over time (momentum) and by platform (who's driving it). The **AI Performance Breakdown** table puts hard numbers to it — revenue, orders, AOV, and share per source.
**User Behavior and Session Time Distribution** cover engagement quality: total active users, average session length and pages, **bounce rate**, and a health read, plus how sessions split across time buckets (from under a minute to 10+ minutes) graded low, average, and high engagement. This tells you whether AI visitors are actually engaging or bouncing.
**Top Products by Views** ranks products on how they move through view → cart → purchase, with the conversion rates between each step — useful for spotting a product that gets looked at but never bought. **Daily Activity** charts views, cart adds, and purchases day by day so you can tie spikes back to what you shipped or published.
 **Advanced Analytics is the honesty centerpiece — spend a moment here.** This section reconciles two ways of measuring AI traffic:
* **The first-party pixel** tags an AI session at the source, so it captures more of your true AI traffic.
* **Google Analytics (GA4)** only credits AI sessions that arrive with an intact referrer — 35–70% arrive *without* one and get filed under "Direct."
The **cross-source check** shows both side by side and reports the overlap — e.g. GA4 independently confirms a large share of what the pixel attributes to AI. That agreement is the point: it validates the pixel's number while being transparent that GA4 undercounts. The practical takeaway, stated right on the page: **treat the GA4 figure as a floor, not the ceiling.** agentShop never claims perfect attribution — it shows you both numbers and where they differ.
Put together: the top cards and funnel tell you how AI traffic is converting, the source breakdowns tell you which assistant is doing the work, the behavior and product tables tell you *why* people convert or don't — and the Advanced Analytics section tells you how much to trust the figures, honestly.
## Related topics
- [Screen Reference: Every agentShop Screen at a Glance](/user-guide/screens/overview.md)
- [Reports: Pre-Built Analytics for AI Commerce Performance](/user-guide/screens/reports.md)
- [AI Attribution: Why Your Revenue Numbers Are Incomplete](/user-guide/concepts/ai-attribution.md)
- [agentShop Settings: Store, Integrations, and Billing](/user-guide/screens/settings.md)
- [Quick Start: Connect Shopify and Run Your First Brand Audit](/user-guide/quickstart.md)
**Advanced Analytics is the honesty centerpiece — spend a moment here.** This section reconciles two ways of measuring AI traffic:
* **The first-party pixel** tags an AI session at the source, so it captures more of your true AI traffic.
* **Google Analytics (GA4)** only credits AI sessions that arrive with an intact referrer — 35–70% arrive *without* one and get filed under "Direct."
The **cross-source check** shows both side by side and reports the overlap — e.g. GA4 independently confirms a large share of what the pixel attributes to AI. That agreement is the point: it validates the pixel's number while being transparent that GA4 undercounts. The practical takeaway, stated right on the page: **treat the GA4 figure as a floor, not the ceiling.** agentShop never claims perfect attribution — it shows you both numbers and where they differ.
Put together: the top cards and funnel tell you how AI traffic is converting, the source breakdowns tell you which assistant is doing the work, the behavior and product tables tell you *why* people convert or don't — and the Advanced Analytics section tells you how much to trust the figures, honestly.
## Related topics
- [Screen Reference: Every agentShop Screen at a Glance](/user-guide/screens/overview.md)
- [Reports: Pre-Built Analytics for AI Commerce Performance](/user-guide/screens/reports.md)
- [AI Attribution: Why Your Revenue Numbers Are Incomplete](/user-guide/concepts/ai-attribution.md)
- [agentShop Settings: Store, Integrations, and Billing](/user-guide/screens/settings.md)
- [Quick Start: Connect Shopify and Run Your First Brand Audit](/user-guide/quickstart.md)