> ## Documentation Index
> Fetch the complete documentation index at: https://docs.useagentshop.com/llms.txt
> Use this file to discover all available pages before exploring further.
# Reports Reference: Every agentShop Report Explained
> What each of the nine agentShop reports shows, and when to use it — revenue, funnel, visibility, competitive, and recovery analytics.
This is a breakdown of every report in the library — what it shows and when to reach for it. For how the library itself works (tabs, filters, categories), see the **Reports** screen reference.
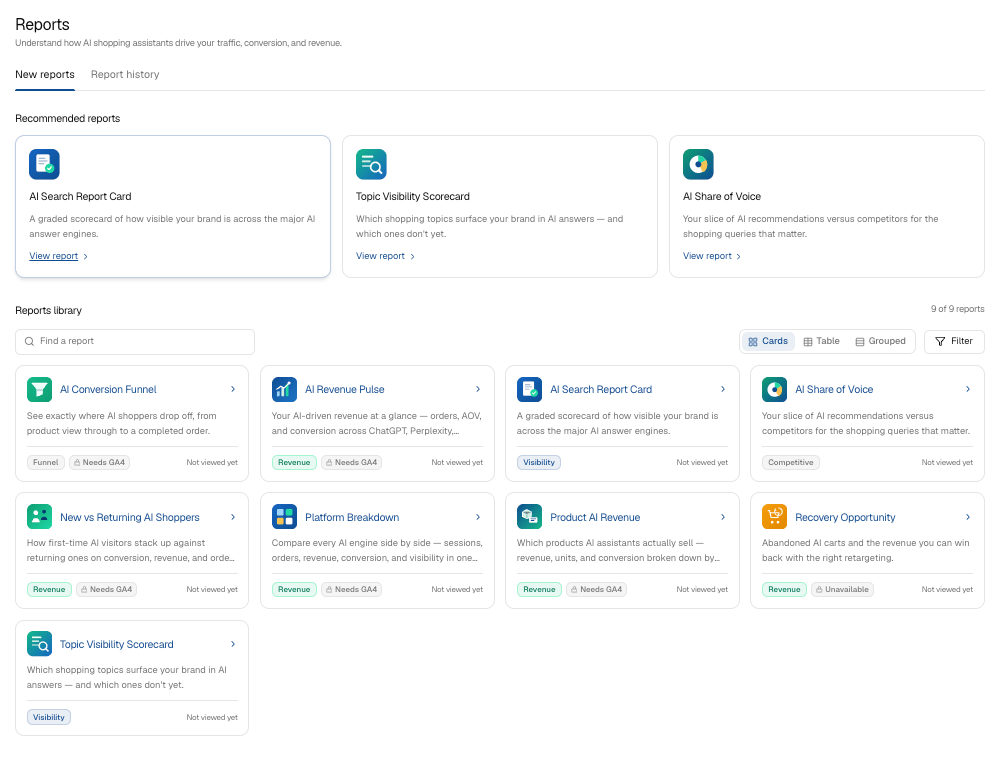 One note that applies across the revenue reports: the commerce numbers come from GA4, which only attributes AI visits that arrive with an intact referrer. Read every revenue and session figure as a conservative floor, not a ceiling — the first-party pixel captures more.
## AI Revenue Pulse
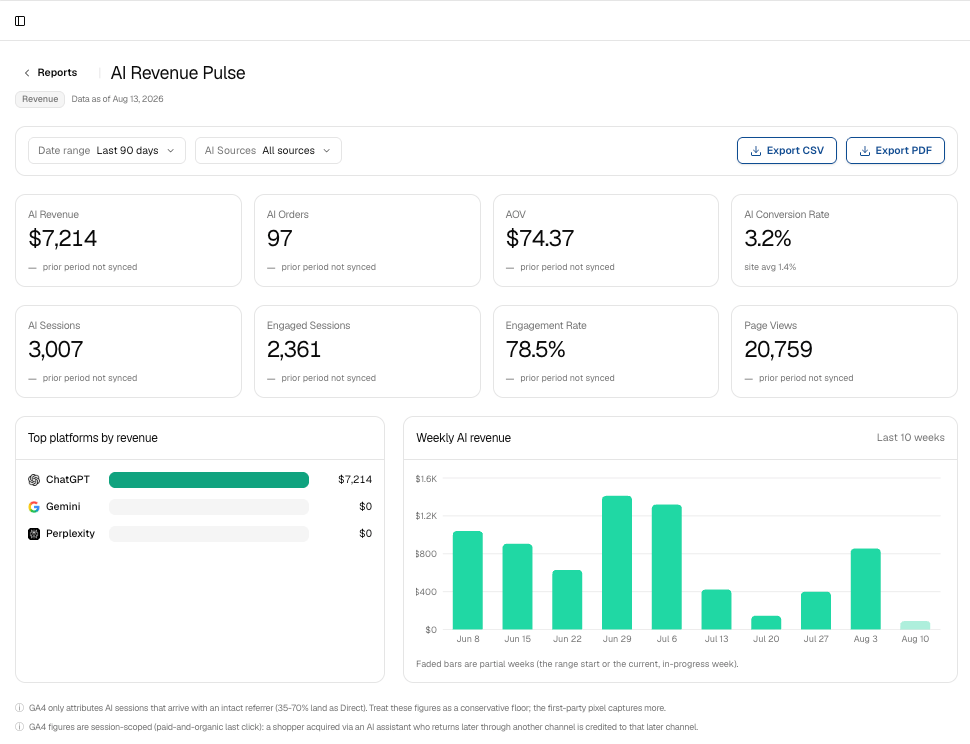
*Your weekly pulse-check.* AI-driven revenue at a glance — AI Revenue, AI Orders, AOV, and AI Conversion Rate, plus sessions and engagement, each against the previous period. **Top platforms by revenue** ranks the assistants producing sales, and **Weekly AI revenue** trends the last 10 weeks. Open it to answer: is AI revenue growing, and which assistant is carrying it?
One note that applies across the revenue reports: the commerce numbers come from GA4, which only attributes AI visits that arrive with an intact referrer. Read every revenue and session figure as a conservative floor, not a ceiling — the first-party pixel captures more.
## AI Revenue Pulse
*Your weekly pulse-check.* AI-driven revenue at a glance — AI Revenue, AI Orders, AOV, and AI Conversion Rate, plus sessions and engagement, each against the previous period. **Top platforms by revenue** ranks the assistants producing sales, and **Weekly AI revenue** trends the last 10 weeks. Open it to answer: is AI revenue growing, and which assistant is carrying it?
 ## AI Conversion Funnel
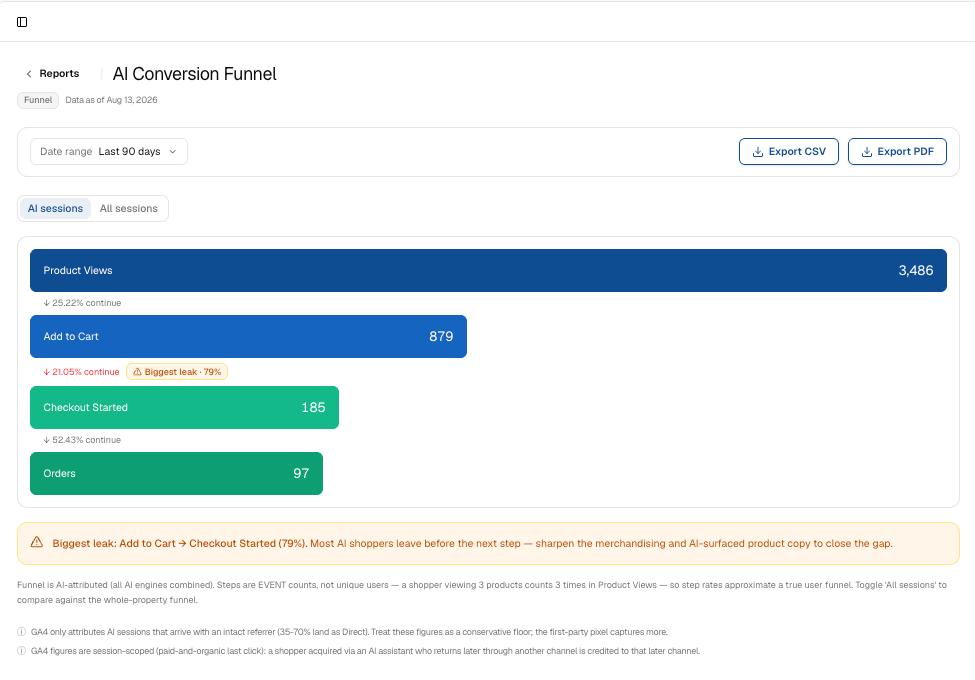
*Find where you're losing orders.* Tracks Product Views → Cart Added → Checkouts → Orders, with the continue rate at each step and the **biggest leak** flagged. Toggle AI sessions vs. all sessions to compare AI shoppers against your whole store. Steps are event counts, not unique users, so read the rates as an approximate funnel.
## AI Conversion Funnel
*Find where you're losing orders.* Tracks Product Views → Cart Added → Checkouts → Orders, with the continue rate at each step and the **biggest leak** flagged. Toggle AI sessions vs. all sessions to compare AI shoppers against your whole store. Steps are event counts, not unique users, so read the rates as an approximate funnel.
 ## AI Search Report Card
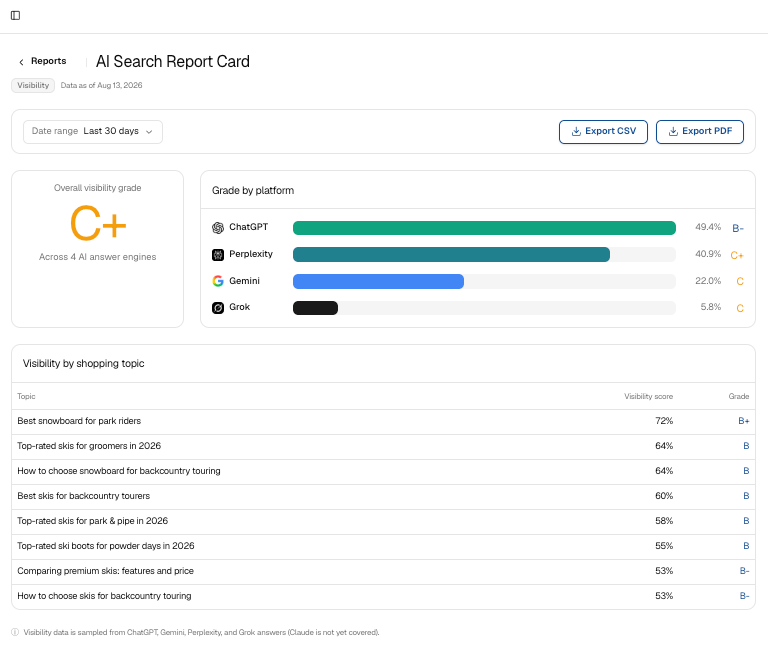
*Are we getting chosen?* A graded scorecard of your visibility across the major AI answer engines — an overall grade, a grade per platform (ChatGPT, Gemini, Perplexity), and a visibility score per shopping topic. Hit Refresh to re-sample. (Sampled from ChatGPT, Gemini, Perplexity, and Grok; Claude isn't covered yet.)
## AI Search Report Card
*Are we getting chosen?* A graded scorecard of your visibility across the major AI answer engines — an overall grade, a grade per platform (ChatGPT, Gemini, Perplexity), and a visibility score per shopping topic. Hit Refresh to re-sample. (Sampled from ChatGPT, Gemini, Perplexity, and Grok; Claude isn't covered yet.)
 ## AI Share of Voice
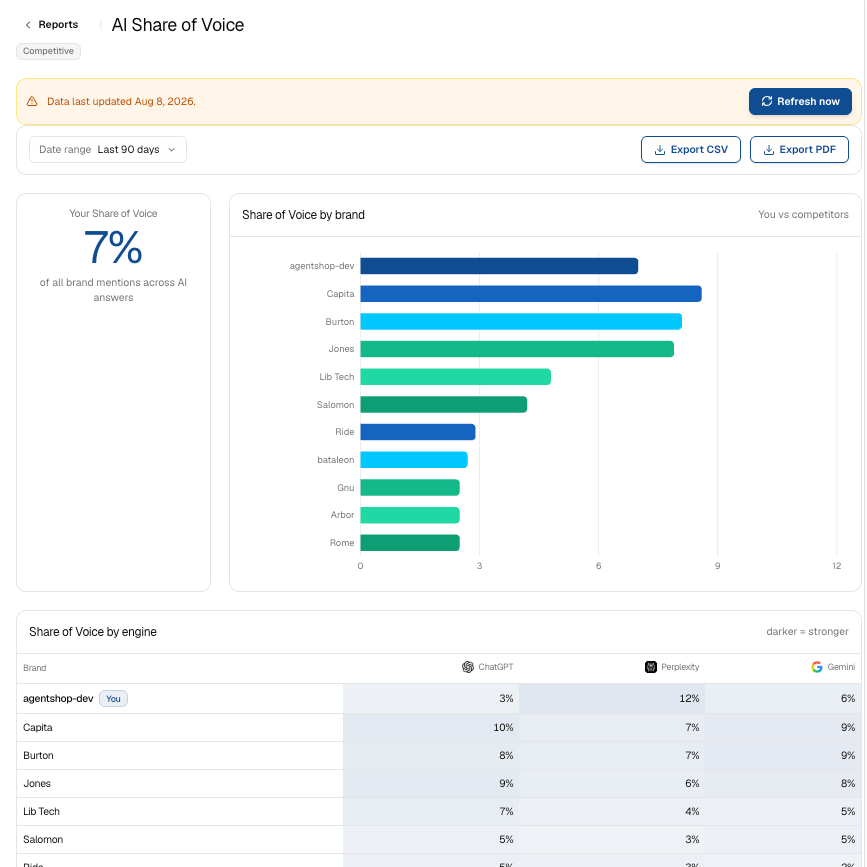
*You vs. the competition.* Your slice of AI recommendations versus competitors for the queries that matter — your overall share of brand mentions, a chart of you vs. competitors, and a by-engine table showing where a rival is beating you. Use **Manage competitors** to set the comparison set.
## AI Share of Voice
*You vs. the competition.* Your slice of AI recommendations versus competitors for the queries that matter — your overall share of brand mentions, a chart of you vs. competitors, and a by-engine table showing where a rival is beating you. Use **Manage competitors** to set the comparison set.
 ## New vs. Returning AI Shoppers
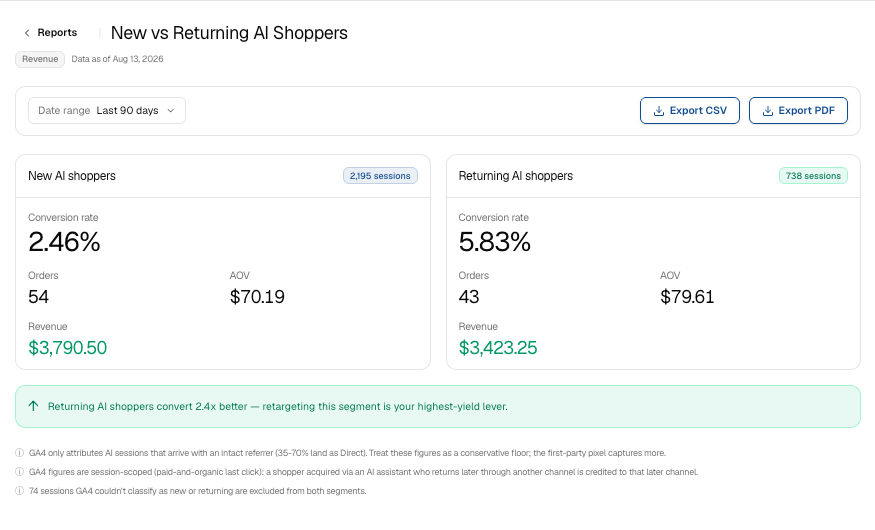
*Where retargeting pays off.* Compares first-time AI visitors to returning ones on conversion, orders, AOV, and revenue. Returning shoppers usually convert far better — which tells you retargeting that segment is a high-yield lever.
## New vs. Returning AI Shoppers
*Where retargeting pays off.* Compares first-time AI visitors to returning ones on conversion, orders, AOV, and revenue. Returning shoppers usually convert far better — which tells you retargeting that segment is a high-yield lever.
 ## Platform Breakdown
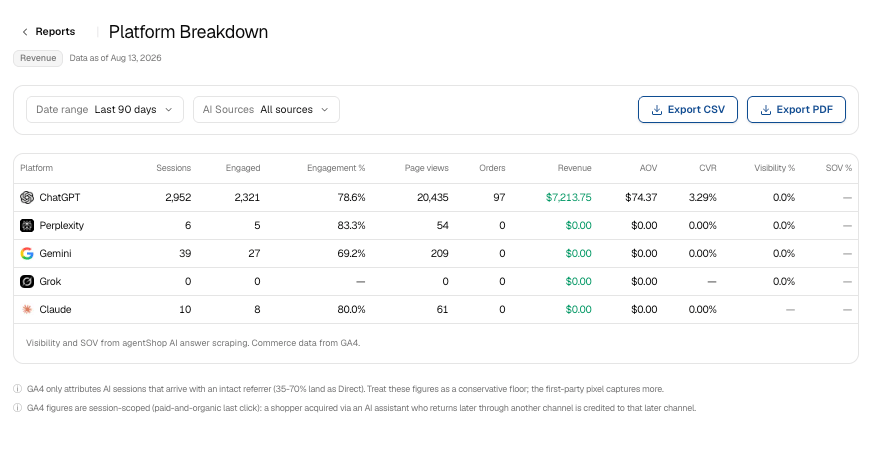
*Every engine in one table.* All AI engines side by side — Sessions, Engaged, Engagement %, Page Views, Orders, Revenue, AOV, CVR, Visibility %, and SOV %. Visibility and SOV come from agentShop's answer scraping; the commerce columns come from GA4.
## Platform Breakdown
*Every engine in one table.* All AI engines side by side — Sessions, Engaged, Engagement %, Page Views, Orders, Revenue, AOV, CVR, Visibility %, and SOV %. Visibility and SOV come from agentShop's answer scraping; the commerce columns come from GA4.
 ## Product AI Revenue
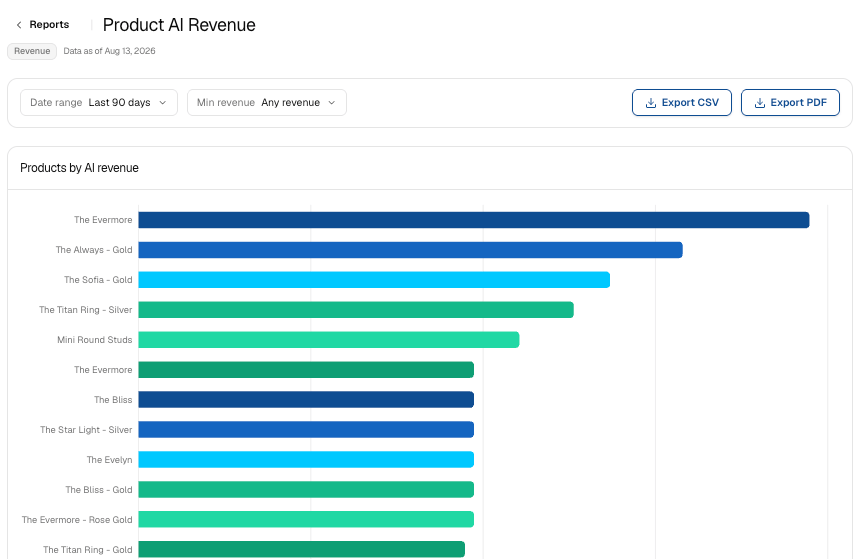
*What AI is already selling for you.* Which products AI assistants actually sell, by revenue, units, and AI CVR (a view-to-purchase rate). A chart ranks products by AI revenue and the table flags your top-revenue SKUs — use it to pick which winners deserve deeper product-page optimization.
## Product AI Revenue
*What AI is already selling for you.* Which products AI assistants actually sell, by revenue, units, and AI CVR (a view-to-purchase rate). A chart ranks products by AI revenue and the table flags your top-revenue SKUs — use it to pick which winners deserve deeper product-page optimization.
 ## Recovery Opportunity
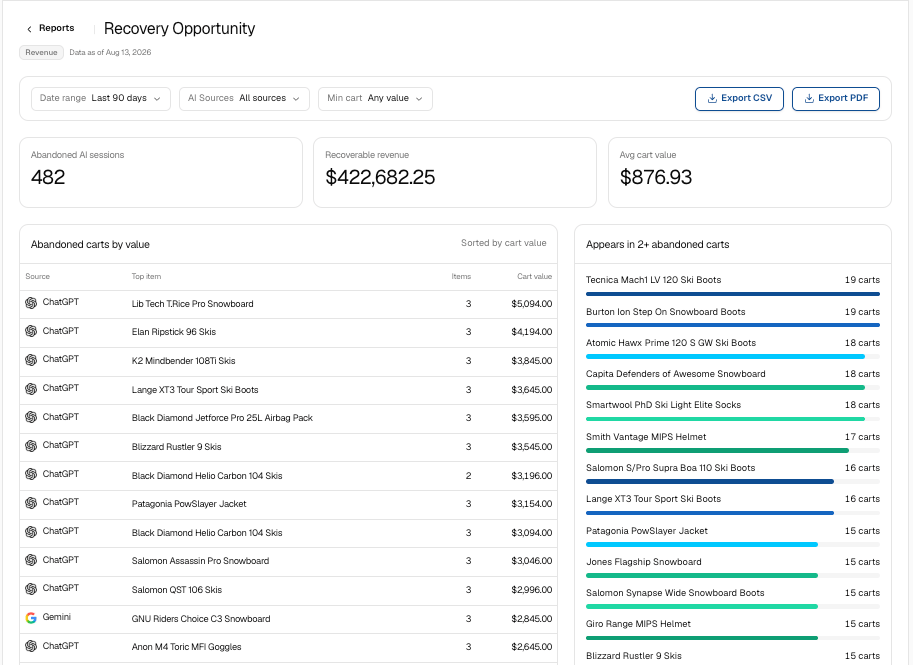
*Revenue you can win back.* Abandoned AI carts and the revenue you could recover — abandoned sessions, recoverable revenue, and average cart value up top, then carts sorted by value plus an "appears in 2+ abandoned carts" list of repeat offenders. (May show as Unavailable until its data source is connected.)
## Recovery Opportunity
*Revenue you can win back.* Abandoned AI carts and the revenue you could recover — abandoned sessions, recoverable revenue, and average cart value up top, then carts sorted by value plus an "appears in 2+ abandoned carts" list of repeat offenders. (May show as Unavailable until its data source is connected.)
 ## Topic Visibility Scorecard
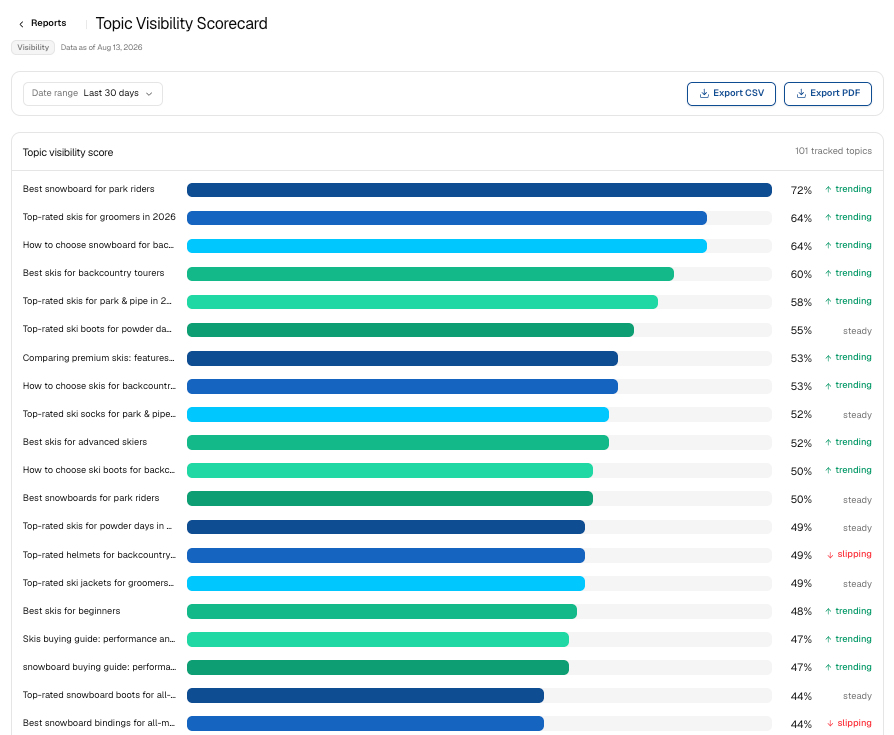
*The topics you're missing.* A ranked list of your tracked topics, each with a visibility-score bar, a percentage, and a trend indicator (steady / up / down). Shows when the data was last updated (with Refresh) and exports to CSV or PDF. Use it to find high-intent topics where you're absent or slipping, then aim your content and product-page work at those gaps.
## Topic Visibility Scorecard
*The topics you're missing.* A ranked list of your tracked topics, each with a visibility-score bar, a percentage, and a trend indicator (steady / up / down). Shows when the data was last updated (with Refresh) and exports to CSV or PDF. Use it to find high-intent topics where you're absent or slipping, then aim your content and product-page work at those gaps.
 ## Related topics
- [Screen Reference: Every agentShop Screen at a Glance](/user-guide/screens/overview.md)
- [agentShop User Guide: Get Chosen by AI Assistants](/user-guide/introduction.md)
- [Troubleshooting Common agentShop Issues](/user-guide/troubleshooting.md)
- [agentShop Glossary: Key AI Commerce Terms Explained](/user-guide/glossary.md)
- [Reports: Pre-Built Analytics for AI Commerce Performance](/user-guide/screens/reports.md)
## Related topics
- [Screen Reference: Every agentShop Screen at a Glance](/user-guide/screens/overview.md)
- [agentShop User Guide: Get Chosen by AI Assistants](/user-guide/introduction.md)
- [Troubleshooting Common agentShop Issues](/user-guide/troubleshooting.md)
- [agentShop Glossary: Key AI Commerce Terms Explained](/user-guide/glossary.md)
- [Reports: Pre-Built Analytics for AI Commerce Performance](/user-guide/screens/reports.md)